Case Study
Case Study
A case study covering Oiva's problem domain, design, and future work.
Overview: What is Oiva?
Oiva is a self-hosted, open-source service for AI-assisted incident investigation. When a production alert fires, Oiva authenticates that alert and launches an investigation that queries the team’s existing observability stack and Git repositories. Oiva then returns a structured report with findings and a supporting evidence trail, easing the on-call engineer’s cognitive load and aiming to reduce time-to-resolution by compressing the initial context-gathering phase.
Problem Domain
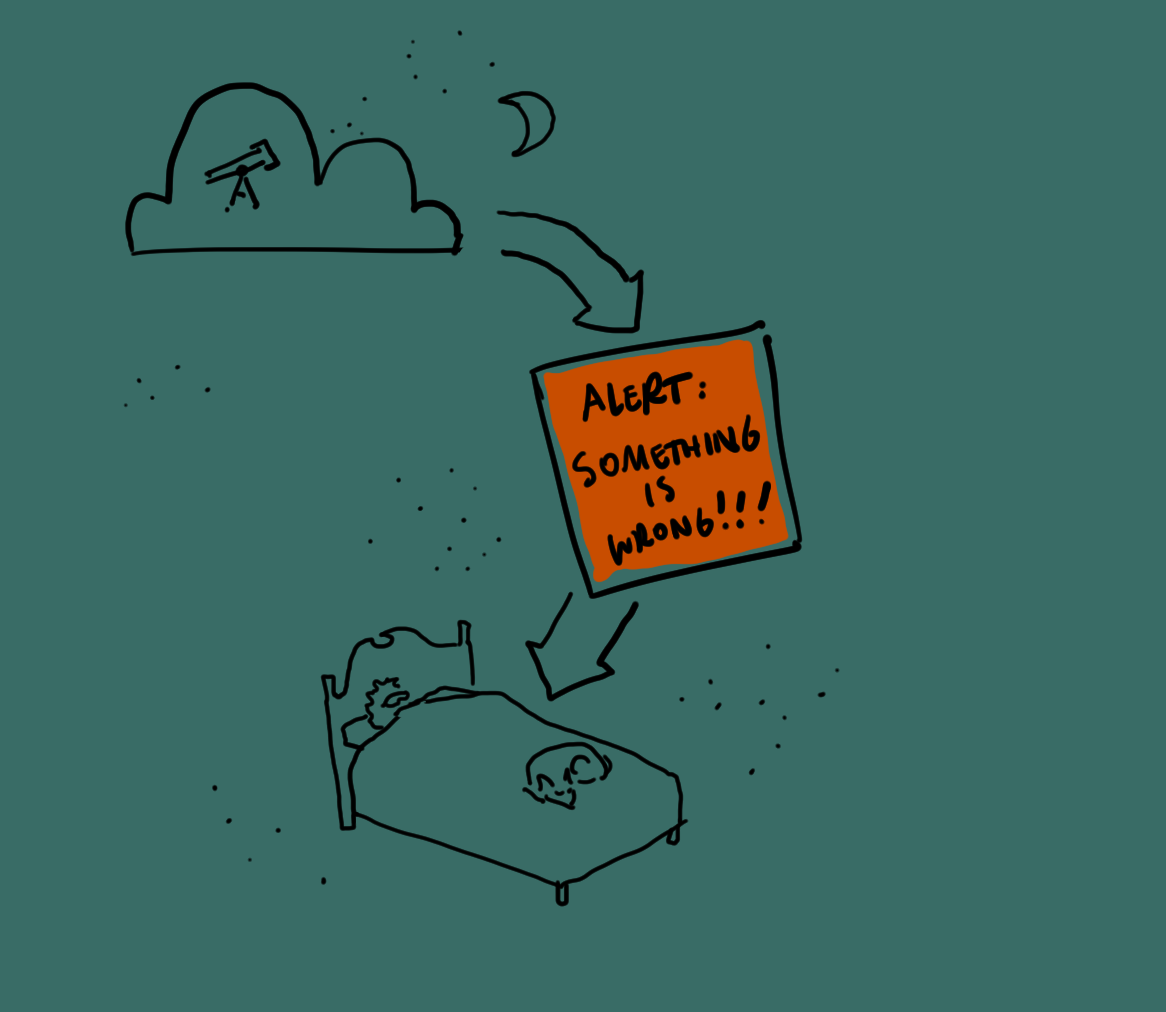
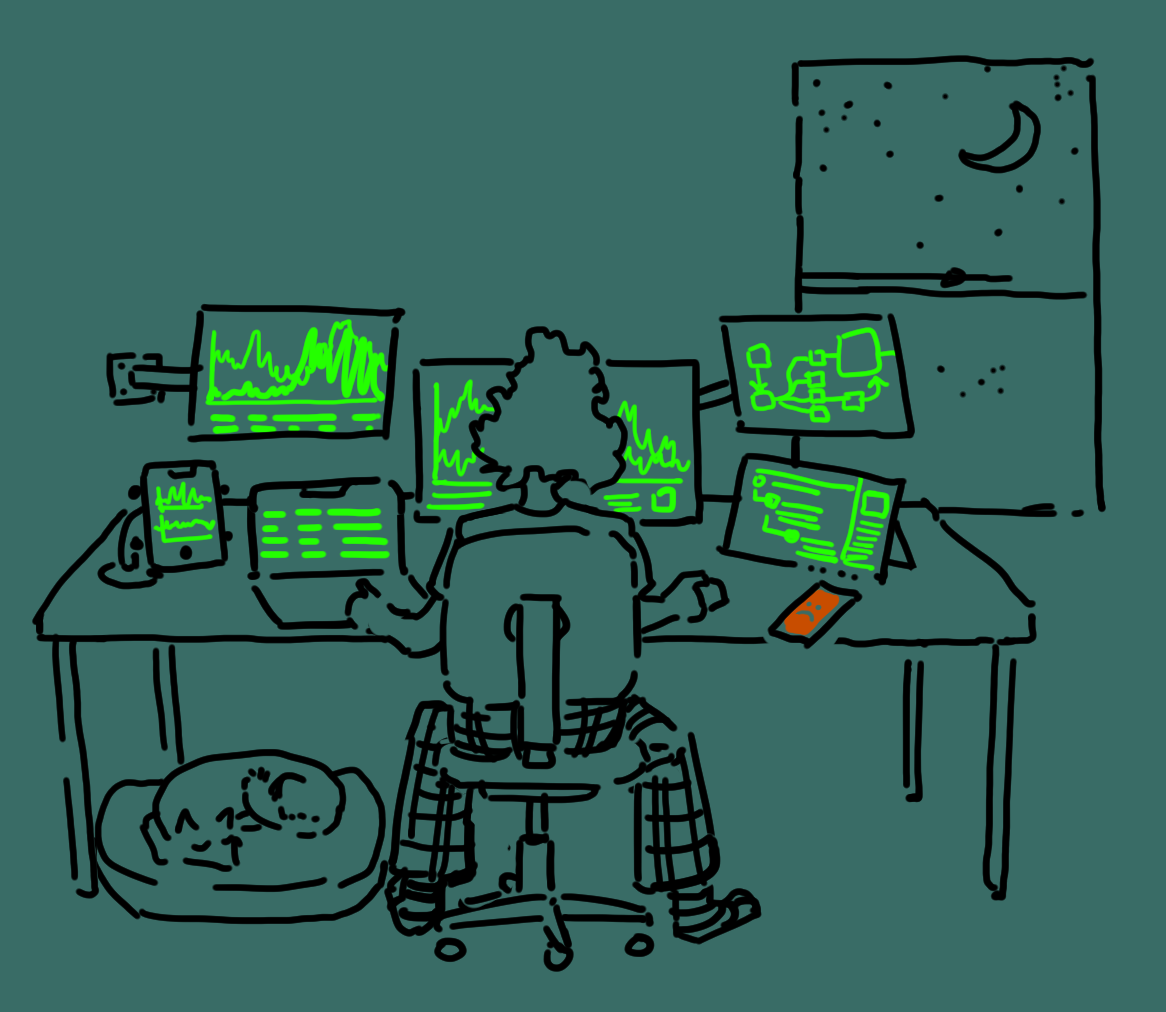
Nearly all production systems are complex and distributed and can fail in unforeseeable ways. A timeout in one service can trigger a retry storm two network hops upstream, a latency spike originating in a database connection pool can surface in a different service, or a small code change in an error handler can produce a type error that bubbles up the call chain and produces a sudden spike in 500 errors. In production, the symptoms of an incident and its underlying cause are often spread across a system, making it especially challenging for on-call engineers, who, when an alert fires at 2 a.m., have to quickly determine what broke and where before they can even start thinking about how to fix it.
That initial investigation can be the most challenging and time-consuming part of incident response. Before any engineer can even form a hypothesis about what happened, they have to query their telemetry, scan dashboards, and correlate different signals across services. The tools they’ll reach for first will be their observability stack, such as Honeycomb, SigNoz, or Datadog, which stores and surfaces telemetry.
But these tools are limited in how they can assist engineers in investigating incident alerts. This is true whether the team adopts the more traditional approach to observability, with its emphasis on the “three pillars” of metrics, logs, and traces, or the newer paradigm that supports a wide-event model. Within the former, a team’s metrics can indicate that something is wrong in the system, logs can provide additional details of the issue, and traces can reconstruct a request’s path. Still, the engineer has to manually stitch all of these signals together to build a coherent story about what is happening.
The newer paradigm consolidates these different signals into a single source of truth: wide, high-cardinality events that can be sliced and queried along any dimension. However, the engineer can be overwhelmed by the task of deciding how to efficiently and effectively query that vast data store while production is down and the clock is ticking. Thus, whether the team’s telemetry is fragmented across different signal types or unified in a massive data store, the initial investigation still imposes a substantial cognitive burden on the on-call engineer.
AI SRE assistants are a new category of agentic tools that aim to alleviate this burden and assist on-call engineers when they receive alerts about incidents in production systems. Many solutions propose putting LLM-based agents to work on the initial investigation process, so by the time the on-call engineer wakes from their slumber and reaches for their laptop, the agent has already parsed the alert, queried the telemetry, correlated initial evidence streams, and proposed the next steps. These agents are part of the fast-growing space of AI developer tools, each adopting different approaches and targeting different types of users. We’ll look at some of the existing solutions next.
Existing Solutions
AI SRE developer tools have grown quickly in 2026, and many current products can be categorized into three broad categories: standalone autonomous agents built specifically to investigate production incidents, AI agents native to the observability platform they’re built on, and incident management platforms that have extended into AI-assisted investigation tools. Each of these approaches reveals strengths and limitations.
Standalone Autonomous AI SRE Agents
The most direct analogs to Oiva are autonomous, purpose-built investigative agents. Cleric provides an illustrative example: when an alert fires, their agents investigate a team’s production issues using the team’s existing observability stack. They have read-only access to investigate across a team’s database metrics, network traffic, application logs, and system resources. They then surface their findings in Slack, with links to supporting evidence and a confidence score, learning from feedback across investigations over time, using customer-specific knowledge graphs and their deployment history. Because their agents adopt a continuous learning approach, their system requires onboarding and integration with their customers’ systems, but it can integrate with various observability services, such as Datadog, Grafana, and Prometheus.
Other entrants in this category include Resolve AI and Traversal, commercial products that aim to provide an always-ready agent to triage production alerts and assist on-call engineers. More recently, IncidentFox launched an open-source alternative that automatically investigates incidents and delivers reports to Slack. They also offer a managed SaaS model.
Trade-offs: The commercial options listed above are primarily closed SaaS, so a team would have to adopt the agent as a managed service and accept that they cannot access the agent’s reasoning or integrations beyond the vendor API.
Observability Platform-native Agents
A second category includes agents that are built directly into observability platforms. Datadog’s Bits AI SRE agent is the clearest example. The moment an alert fires, it reads the telemetry stored on its platform, draws on the team’s runbooks and systems, and explores several paths before converging on a likely root cause to hand off to the engineer. Dynatrace’s Davis AI agent works similarly by taking a comparable platform-native approach. Another variant of this idea is Canvas, the AI-assisted investigator built into Honeycomb’s platform, which helps an engineer investigate their team’s stored data but cannot access a team’s codebase or documentation.
Trade-offs: These agents have easy, immediate access to data given their direct integration into the observability platform. This strength also represents their limitation: their investigative power is bounded by the vendor’s ecosystem, so teams have to commit to a new platform or become even more deeply locked into their existing vendor choice. Teams that build their own observability backend cannot leverage this group of tools.
Incident Management Platforms with AI-Assisted Investigations
The third group represents the coordination with a team’s incident response and management workflow. For example, incident.io began as an incident coordination and management platform and later added investigations that can run parallel searches across a team’s alerts, telemetry, codebase, and incident history, delivering actionable findings. Rootly is another competitor in this category that first developed response coordination and later integrated investigation assistance.
Trade-offs: Because Incident.io and Rootly are both proprietary, hosted platforms, their agentic tool offerings will be most compelling to teams that have already adopted these platforms to manage their incident response workflows.
Taken together, these existing solutions validate the main idea behind Oiva – an agent that investigates the moment an alert is fired and provides the on-call engineer with a structured, evidence-backed starting point - as one that is being pursued by many well-resourced teams. The demand for these tools is also evident in other organizations, such as Pinterest, which built a bespoke internal version of an AI investigative agent named Tricorder, presumably because they could not find a simple, off-the-shelf solution that met their needs.
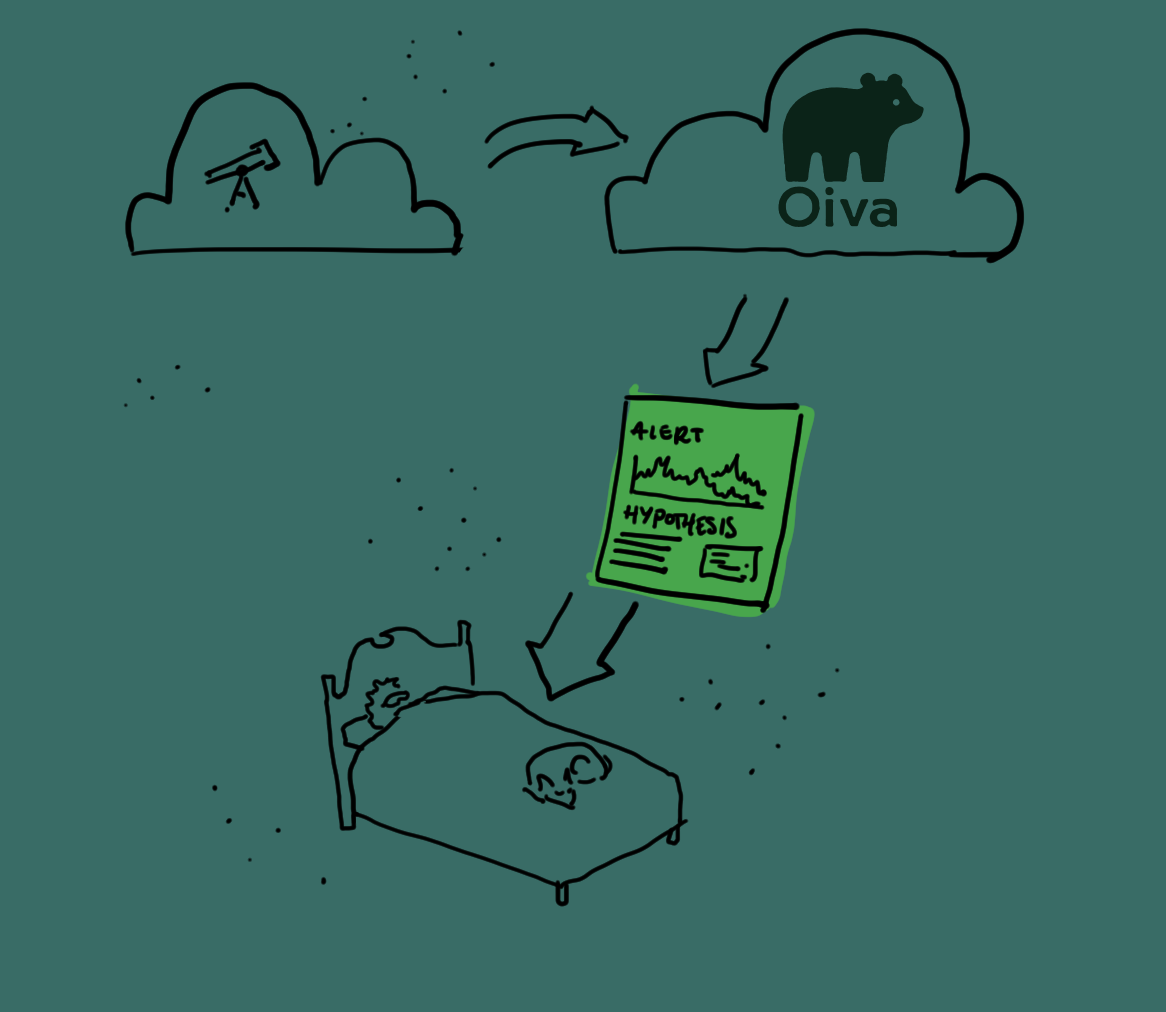
Introducing Oiva
Oiva is a self-hosted, open-source incident investigation agent. When a production alert is triggered, Oiva receives the alert via a webhook, authenticates it, and orchestrates an investigation into the team’s observability data and relevant codebase. The agent then produces and delivers a structured report to a dedicated Slack channel. The final report includes a hypothesis about the root cause, the evidence trail supporting it, and a clear set of next steps. Teams also receive live updates on ongoing investigations via Slack and can download a full report on the incident after the agent completes its investigation.


Oiva’s aim is not to replace the engineer’s judgment but to compress the slowest and often most stressful part of incident response: the initial scramble for context.
| Capability | Oiva | Standalone autonomous agents Cleric, Resolve AI, Traversal | IncidentFox | Observability-platform-native Datadog Bits AI, Dynatrace Davis | Incident-management platforms incident.io, Rootly |
|---|---|---|---|---|---|
| Open-source | yes | no / not a focus | yes | no / not a focus | no / not a focus |
| Self-hostable | yes | no / not a focus | yes | no / not a focus | no / not a focus |
| Obs-stack neutral | yes | yes | yes | no / not a focus | partial or limited |
| Wide-event focused | yes | no / not a focus | no / not a focus | no / not a focus | no / not a focus |
| Transparent, reproducible evals | yes | partial or limited | partial or limited | partial or limited | no / not a focus |
| Read-Write Agent | no / not a focus (read-only) | yes | partial or limited | partial or limited | yes |
| Continuous Learning | no / not a focus | yes | yes | yes | yes |
The existing solutions surveyed above illustrate the growing demand for agentic tools that can help engineers investigate production incidents. Oiva offers a specifically scoped, open-source solution defined by the following three commitments: First, our prototype is built on the wide-event, high-cardinality observability model, treating rich, structured events as the primary target for investigation. Second, we treat evaluation as a primary concern so we can answer questions not only about what the agent investigates or when it does so, but also about how well it does so. Third, our architecture can be extended rather than consumed as a service.
Oiva is built for on-call engineers and small to midsize platform teams who cannot justify or don’t want to be locked into a specific commercial AI SRE platform. Because it’s open-source and self-hostable, it can serve teams with sensitive data customization needs that managed services may not easily provide, as well as teams who prefer a transparent agent they can inspect and extend to fit their needs.
Design Decisions & Trade-offs
Agent Design
At the core of Oiva’s incident workflow is the investigation phase, the agentic process surrounded by the application’s deterministic edges. It encompasses two specialized domains: querying and interpreting telemetry data and examining the user’s codebase and Git history. Oiva then synthesizes the findings into a cohesive hypothesis with actionable next steps. This phase poses a central design challenge and directly affects the quality of Oiva’s incident reports. The ask is big: the agent must be built to reason reliably about an open-ended alert, investigate each domain effectively while sticking to various specialized instruction sets, and synthesize surfaced data accurately, minimizing hallucinations as the investigation context grows.

Multi-Agent System
Oiva is a multi-agent system rather than a single general-purpose agent. An early prototype took the latter approach, offering simplicity and cost-effectiveness by minimizing LLM calls within a single loop. Its limits became apparent as we expanded domain-specific capabilities. The tight coupling of components within a single agent made it much harder to develop, scope, and test new additions. Thus, Oiva transitioned to a system in which a supervisor and specialized subagents split responsibilities. A separate report agent sits downstream of the investigation step, rendering relevant findings into Oiva’s main user-facing deliverable – the incident report.


The supervisor agent owns the investigation as a whole. It interprets the incoming alert and orchestrates the investigation flow by delegating tasks to its subagents. The supervisor never queries telemetry or source code directly and has no access to the domain-specific tools. Instead, it calls the relevant subagents as needed and synthesizes their findings into a hypothesis, refining it over the course of the investigation to form an accurate analysis.
Each subagent is responsible for one investigation domain and operates within the scope of its specialized context and tooling upon delegation from the supervisor. The telemetry agent queries and interprets observability data. It identifies anomalies and affected services and endpoints and narrows down the incident’s timeframe. The codebase agent examines the user’s source code and recent change history to detect code-related culprits. When it finishes, each subagent returns a summary of its findings to the supervisor for further analysis.
Beyond separating responsibilities to simplify development and keep instruction sets focused, the multi-agent design addresses other limitations of single-agent architectures. These include context management and switching issues, as well as error propagation. Each is central to the design problem Oiva presents.
If a single agent held the alert, all instructions and tools, every query and raw result, all inspected files, and the reasoning logic in its context simultaneously, its analysis would likely degrade as it sifted through irrelevant information within a growing context window. Since Oiva assigns each sub-investigation to a specialized agent, raw investigation data is contained within that subagent, and unnecessary data is less likely to leak into the broader investigative context. This approach is consistent with research on multi-agent systems, which suggests that single-agent architectures lead to context window management failures that multi-agent designs can mitigate.
Research also indicates that multi-agent systems minimize the risk of an early mistake propagating throughout the investigation, reducing the likelihood of hallucinations. Such findings ground Oiva’s design: the supervisor agent acts as a reasoning checkpoint that weighs surfaced data against its collected evidence and re-queries subagents when clarification is needed.
Similarly, instead of folding report generation into the supervisor agent or assigning the report agent as its subagent, Oiva separates formatting-related tasks from the investigation. Decoupling the two improves development and independent testing, keeps instructions focused, and limits the report generation context to the final synthesized findings.
Limitations & Tradeoffs of Multi-Agent Systems
A multi-agent system has limitations worth surfacing. Spreading the investigation across specialized agents results in more LLM calls than a single-agent design, increasing costs in latency and token usage. For Oiva, this is an acceptable tradeoff. On average, Oiva delivers a report within 5 minutes of receiving an alert, comfortably within the time it takes an engineer to become aware of an issue, reach their environment, and start troubleshooting. Those extra LLM calls also buy Oiva the depth that an effective incident report depends on. The quality of both the sub-investigations and the supervisor’s synthesis shapes the hypothesis’s accuracy and the final report’s detail.
Better context isolation has a flip side: the data must flow across the boundary between agents. Context window management is a dial we tune to balance minimizing context bloat against data loss between agent calls. Oiva handles this with a bloat-reducing approach by limiting the message history the supervisor passes down, capping agent iterations at a configurable maximum, and returning only curated summaries to the supervisor. The consequence is that evidence can be lost. Once a subagent delegation ends, Oiva’s supervisor loses access to the raw results for that specific sub-investigation. It can only reason about what the subagent handed back, and re-query the subagent if it deems those findings are unclear.
To make subagent behavior less opaque, we implemented a partial Investigation Trace feature that surfaces details about subagent behavior in Oiva’s final report. We also instrumented Oiva for observability, providing deeper insight into its investigation runs and using evaluation strategies to analyze agent behavior, data flow, and the quality of Oiva’s reports (see Evals & Testing section). Next, we focus on the key decisions when designing the two subagents.
The Telemetry Subagent
Investigation Tools
Our ideal for Oiva is to offer vendor-neutral adaptability across a range of observability backends, many of which offer MCP (Model Context Protocol) servers for connecting LLM agents to external tools and data. We leveraged Honeycomb’s MCP server to equip Oiva’s telemetry subagent with specialized tools for querying and analyzing users’ observability data. To guide the agent’s proper use of the tools, we built a custom method with which the agent grounds its investigation (see the Evals & Testing section below).
System Prompt Guidance
The subagent’s system prompt was designed to outline a runbook-like sequence for its telemetry investigation. It must first orient its search based on the triggered alert, then follow a statistics-first process to detect error rates and affected services or endpoints. The agent then breaks dominant error patterns into specific dimensions and correlates anomalous ones with a time window and change pattern.
Surfacing Investigation Steps
Like any investigation, LLM-powered or human, Oiva can make mistakes. AI-powered investigations often produce results that “look correct” but are subtly wrong due to insufficient supporting evidence. For example, if Oiva reports that an API call is the source of the error, but never consults a trace to confirm this hypothesis, the user will only learn about this oversight if they audit the investigation steps and conduct their own research to fill in the holes.
We enable Oiva users to audit the investigation and view the actual query results Oiva consulted using an “investigation trace”:

The Codebase Subagent
To effectively investigate the user’s repositories, the codebase agent is equipped with:
- a system prompt that describes how to investigate the codebase and examples of common bugs
- a filesystem with a
knowledge-base/directory containing architectural and operational information about the user’s application - a sandbox with a fresh clone of the user’s codebase, indexed for BM25 keyword search to rank files and snippets by relevance
- LSP-based code intelligence for TypeScript, JavaScript, Python, Go, and Rust, enabling the agent to inspect symbols, definitions, references, and language-level errors using the same protocol as many code editors
- tools to navigate the filesystem and issue shell commands
- Mastra’s
WorkingMemoryfeature to track and update the agent’s hypotheses and research in a token-efficient way
Repository Authorization: PAT, OAuth, or GitHub App
Oiva currently uses a GitHub fine-grained Personal Access Token (PAT). This is the simplest setup for the current version of Oiva: users grant read-only access to specific repositories, and Oiva clones them directly during an investigation. The main downside is that PATs are user-owned credentials, so rotation, revocation, and ownership become awkward if the user leaves or their permissions change. OAuth is better suited to a UI-based “Connect GitHub” flow, and access would still be tied to an individual user. Long-term, a GitHub App is the strongest production model because it gives Oiva its own installation identity, fine-grained repository permissions, short-lived tokens, and webhook support for future integrations with repository events or CI/CD workflows.
GitHub MCP Server vs. Local Repositories
We decided that locally stored repositories provide the most effective code inspection. Initially, Oiva used GitHub’s MCP server to inspect remote repositories. This kept the agent’s code simple, but introduced limitations. The agent made more invalid tool calls to GitHub MCP tools than to the local filesystem and Git tools. Remote inspection also added latency, increased the likelihood of failed requests, and exposed investigations to GitHub rate limits. Local repositories allow the agent to use more advanced tools, including LSP inspection, BM25 search, and direct Git history commands. This also opens a path toward future capabilities, such as testing suggested fixes and creating pull requests.


Investigation workspace isolation
Because Oiva runs investigations on a long-running server rather than launching a fresh container per incident (see Infrastructure below), each investigation needs an isolated code sandbox. Oiva uses separate clones of the observed app because they provide stronger isolation and simpler cleanup. Alternatively, maintaining a shared clone and creating detached Git worktrees for each investigation would reduce clone time and storage usage, but they introduce shared Git state through the base clone, including update coordination, worktree metadata, cleanup, and concurrency concerns. For Oiva, this added complexity outweighs the performance benefits.
Incident Report Delivery
The incident report is Oiva’s main user-facing deliverable, so how, where and when it is rendered shape the user experience. Oiva delivers its reports to a dedicated Slack channel created by the user. It posts an identifiable incident message as soon as the workflow begins and updates it in real time as the investigation progresses. Once the investigation concludes, Oiva renders the full report and posts a downloadable Markdown copy to the thread. Users can rate each report with a thumbs-up or thumbs-down and either retry the incident or close it directly from the message.
Oiva integrates with the user’s existing communication platform rather than providing a standalone dashboard for lower adoption friction. Engineers can quickly flag and read new incident reports without leaving the place where the incident conversation is likely already underway. Additionally, the dedicated incident channel doubles as a scannable history of past incidents.
Code Architecture & Patterns
Mastra Framework
Building an autonomous investigation agent requires substantial boilerplate for features such as agent orchestration, workflows, custom tool invocation, and LLM wiring. We use Mastra, a TypeScript agent framework, as a scaffold for Oiva.
Mastra provides storage for agent memory, workflow snapshots, traces, and eval results. Oiva’s domain data is separate from this storage and resides in its own RDS PostgreSQL instance, serving as the system of record for alerts, incidents, and reports. (We explain that choice in Data-related Decisions.) The two states have different lifecycles, so keeping them separate allows us to query and evolve the domain state independently of the framework.
Hexagonal Ports & Adapters: Extensibility and Testability
Oiva is built using the Ports & Adapters pattern (also known as Hexagonal Architecture). We isolate the investigation core (i.e., the incident lifecycle and its orchestration) behind ports (interfaces), with external systems plugged in as adapters: Honeycomb as the telemetry source, Slack as the notifier, and Postgres for persistence. This pattern makes the app extensible and testable. Adding a new observability backend for webhook alerts (e.g., SigNoz or Datadog) means writing a single new intake adapter without touching the core. And because the app’s core depends on interfaces, we can test its logic using in-memory fakes and build robust test suites.
Data-related Decisions
Oiva persists every alert and incident rather than running an in-memory investigation because the incoming stream of alerts presents three problems that a relational database solves cleanly.
First, the observability backend might redeliver the same webhook alert on retries, so we record the vendor’s event ID and add a partial unique index on (source, vendor_instance_id) to prevent duplicate rows in our alerts table.
Second, because the backend might evaluate triggers on a set schedule, a single 20-minute-latency event that causes a spike in 5** errors can trigger several webhook alerts. To prevent duplicate investigations, we extract each alert’s correlating fields (trigger_name, dataset, and query_id) and match each new alert against active incidents within a recent (configurable) time window. We then attach the alert to an existing incident rather than launching a parallel investigation.
Third, immediately after returning a 202, the handler dispatches the agent’s investigation workflow, which runs in the background. Because we persist the alert before dispatch, that work is recoverable in the event of a crash. The stored alert provides an idempotent receipt that we match to the correct incident. This recovery feature lets users reprocess an interrupted incident using the Retry button in Slack.
Oiva uses PostgreSQL because we can extract what we query into typed relational columns while retaining raw vendor payloads and LLM-structured reports to maintain fidelity. Oiva stores alerts and reports associated with incidents, and our duration-tracking and correlation logic depend on queries across these entities. Postgres makes queries, like “find all alerts belonging to an incident still ‘investigating’”, straightforward. A document store like MongoDB either requires embedded data or relies on multi-collection lookups, which can introduce performance overhead. One advantage of a document store is its ease of storing both raw alert payloads and LLM-structured reports. But this is handled well by Postgres’s jsonb type, which maintains document-style flexibility without sacrificing relational integrity. Oiva supports both data shapes with a single Postgres instance.
Evals & Testing
An autonomous incident-investigation agent is only worth running if its conclusions can be trusted, and the only way to earn that trust is to test it against incidents for which the true root cause is already known. Oiva is evaluated and tested against controlled environments that enable the injection of reproducible faults.
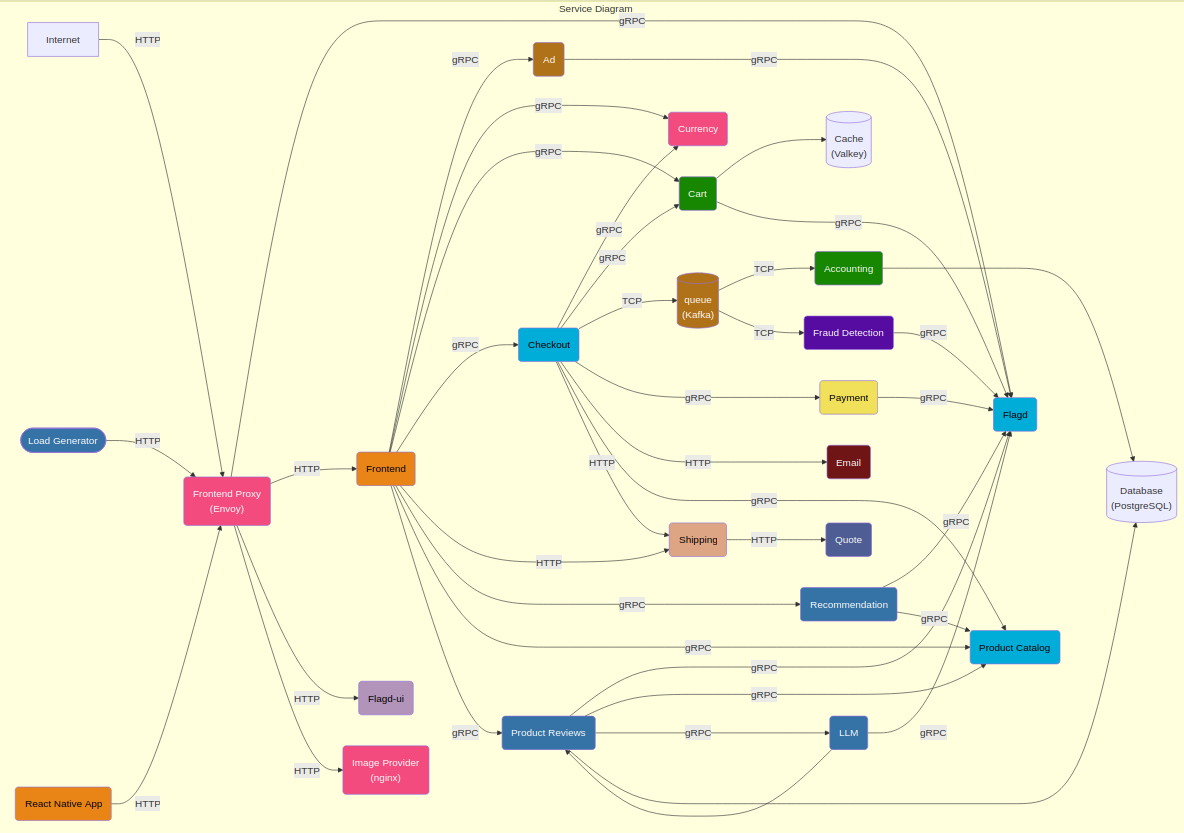
The evaluations are derived from failure scenarios in two demo applications, each chosen to trade control against realism. The first is a purpose-built three-services demo app (gateway ⇒ orders ⇒ inventory) with a runtime fault-injection layer. Its minimal topology provides precise control over what breaks and an unambiguous ground truth to grade against. The second is a fork of the OpenTelemetry Astronomy Shop, a more complex, realistic multi-service storefront that tests the agent against the scale and noise of a production-like system. Together, they ground an eval dataset with scenarios ranging from clean, isolated signals to messier, more realistic incidents.
The experiments share a common design. We inject latency and error faults at the system level and in the application code, and each injection triggers a real Honeycomb alert to which Oiva responds by launching an investigation. To prevent the agent from finding shortcuts to the answers, the experiments include safeguards such as non-descriptive fault codenames, a hidden injection switch, and innocuous or misleading titles on branches and PRs to conceal the experiments.
The value of the evals dataset lies not in the final pass/fail grade, but in the systematic blind spots that each run reveals. Each experiment provides new areas for improvement that feed back into the agent’s design, improving its performance in development and production.


Improving the Foundation of the Telemetry Investigation
One of the biggest problems our evals revealed was that the Telemetry Agent often started on a shaky foundation, making malformed tool calls at the very beginning of the investigation.
Additionally, running evals with canned alerts was difficult because the agent made incorrect assumptions about the relevant timestamps. These assumptions were reasonable for most production alerts but made testing with canned alerts unreliable. Multiple rounds of prompt engineering didn’t improve performance, so we introduced more determinism at the start of the process by building a custom tool that always provides the agent with a clear picture of the alert and its related telemetry.
After this change, malformed tool calls at the beginning of the investigation dropped from ~90% to ~10%, and the agent used a relevant time window 80% of the time, up from less than half.


Infrastructure
At its core, Oiva is a self-hosted, cloud-neutral application that runs in a container and connects to a relational database. To streamline startup for new users, we include a fully provisioned deployment option on Amazon Web Services (AWS), defined with Terraform.

One Application Service vs. Split Services
Oiva runs both the HTTP API and the background workflow in a single container. Splitting into separate web and worker services would improve independent scaling and fault isolation, but requires more deployment units, coordination, and possibly a queue boundary. A single-service design simplifies the architecture and matches the expected workload — likely no more than 15 alerts per week. This effectively trades increased infrastructure complexity for some code complexity, as resources must be allocated and released for each investigation.


Key Decisions for the Provisioned AWS Deployment
A Fully Provisioned System with Escape Hatches through Terraform
Terraform encodes the architecture as a reusable module that includes the network, compute service, database, load balancer, storage bucket, logs, and access policies. This makes deployment more predictable and accessible to teams with little cloud experience. However, we also provide escape hatches for more experienced teams to supply their own AWS components as Terraform variables, such as a virtual private cloud or an ACM certificate.
Running Containers With Fargate

For compute, we chose Amazon ECS with Fargate. ECS is AWS’s container orchestration service, and Fargate is its serverless container runtime: users provide a container image and resource settings, while AWS runs the container without users having to manage virtual machines.
Alternatives include EC2, AWS’s virtual machine service; EKS, AWS’s managed Kubernetes service; or Lambda, AWS’s function-based serverless runtime. EC2 gives more control but requires server maintenance. Kubernetes is powerful but too operationally heavy for Oiva’s needs. Lambda reduces idle infrastructure, but would break down if Oiva’s investigations ever exceeded their 15-minute limit. Fargate is the right balance of container flexibility and low operational burden.
The ECS task also runs an OpenTelemetry collector sidecar that forwards traces to the configured observability backend, while container logs go to CloudWatch, AWS’s managed log service.
Exposing Only What Needs To Be Public
Oiva needs a public URL because Slack and Honeycomb send webhook requests to it. A public Application Load Balancer, a managed AWS entrypoint, receives HTTPS traffic and forwards it to Oiva. The Fargate tasks and the RDS database run in private subnets and are unreachable from the internet. This approach entails additional networking complexity and cost but offers security by allowing private resources to call external APIs without being publicly reachable.
Using Managed Data Services
For persistence, we chose RDS and S3, AWS’s managed relational database and object storage services, respectively. Running Postgres on RDS gives Oiva durable incident and workflow state. S3 stores knowledge base files that contain architectural and operational information about the user’s application.
Simpler alternatives include bundling knowledge files into the container image or self-hosting Postgres in the application environment, but these options complicate updates and degrade reliability. RDS and S3 provide encryption, private access, and managed durability with less operational work than the alternatives.

Handling Secrets Safely
Finally, Oiva’s application secrets are stored in AWS’s Secrets Manager rather than as raw Terraform variables. Our provisioned Terraform deployment creates empty secret placeholders or accepts existing references. This prevents sensitive values from being committed or stored in Terraform state.
Overview of the full architecture
Overall, the provisioned infrastructure favors a secure, reproducible, low-maintenance deployment over maximum scalability or the lowest possible cost.

Future Work
Broadening User Options
Oiva isolates external systems behind adapters to integrate more seamlessly with a variety of third-party options. On the intake side, the source field in the alerts table is designed to ingest webhook alerts from other observability backends (e.g., SigNoz or Datadog) or alerting services (e.g., PagerDuty). On the query side, Oiva can extend its query adapters to other wide-event stores, such as Axiom or ClickStack, and customize its system prompts to investigate incidents wherever users choose to store their observability data. On the delivery side, Oiva could send its findings to additional destinations, such as Microsoft Teams, or directly to the user’s email.
Augmenting Agent Capabilities
Oiva’s multi-agent system design makes it easier to update existing agents and add new ones, as each subagent is isolated and orchestrated by a single supervisor. For example, we could add a dedicated system-health subagent focused on infrastructure checks for users who need such additional support.
Additionally, the codebase subagent provides many opportunities to improve Oiva’s investigative chops. We could extend it to track additional deployment patterns (the current version treats main as deployed), run tests and static checks, identify infrastructure and other dependencies, and add GitHub App integration for authentication and access.
Oiva’s fault-injection evaluation framework provides a testing foundation that can be extended in parallel to include additional fault types, rerun earlier experiments to confirm that blind spots are fixed, and implement improvements in future versions of our subagents.
Improving UX & Deployment-readiness
To improve user experience, we could develop a dedicated UI for users to browse alert and incident history and ask a chatbot follow-up questions about delivered reports. Such an interface, or even a simpler CLI, could also serve as a portal for self-hosters to configure specific agent skills, customize system prompts, or add to the knowledge base. On the operational side, adding CI/CD for image and Terraform builds and splitting investigations into isolated tasks that can run in parallel would harden real Oiva deployments.
These three threads share a main trajectory. As we continue to develop and evaluate Oiva, its responsibilities will expand to include more autonomous actions that help engineers reliably resolve incidents.